1851 Census
Go to the Occupations Page Go to the Names Page
The Coates only pages of Enumeration District 7
(H107 / 1765 / Folios 192 to 211 and pages 20 to 58)
Population
Males 354
Females 395
TOTAL 749
The Coates only pages of Enumeration District 7
(H107 / 1765 / Folios 192 to 211 and pages 20 to 58)
Population
Males 354
Females 395
TOTAL 749
Click to enlarge
|
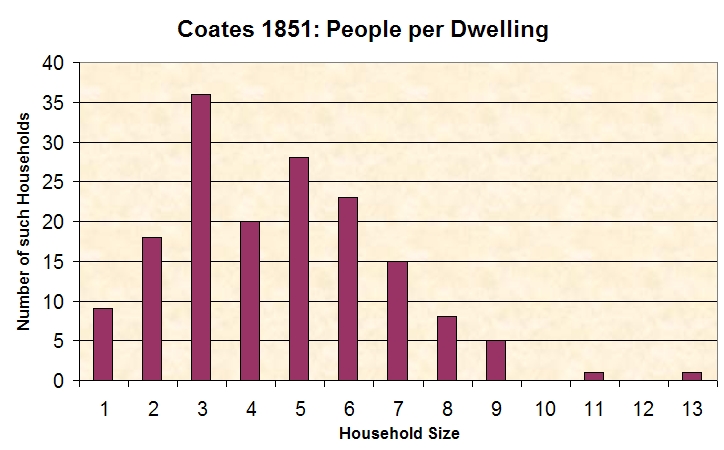
Dwellings There were 164 inhabited dwellings in Coates in 1851. There were 14 uninhabited dwellings. Total 178 dwellings. In 1841 there had been 134 dwellings, in all, compared to 178 in 1851, an increase of 32%. Birth counties 634 of the people listed on the census were born in the county of Cambridgeshire and the remaining 115 were born in other counties. This compares to 1841 when 96.7% of people were born in Cambridgeshire, 1861 when it was 84% and 1871 where the figure was 86%. Places where people were born There is some confusion on the census, in that many entries show people giving Coates as their birthplace yet Coates is crossed through and Whittlesey or an abbreviation is inserted. The commercial genealogy sites take Whittlesey to be the place of birth and, although I did start to substitute Coates as I transcribed the census, I have decided to list them all under Whittlesey. See below |
|
Chart of Relationships to Head
* In two of the 164 households the male Head was not present on the date of the census. There were 19 households in which the Head of the house was female either because the lady in question was a widow or was unmarried. Hence there were 145 households which would, usually, have had a male Head.
* In two of the 164 households the male Head was not present on the date of the census. There were 19 households in which the Head of the house was female either because the lady in question was a widow or was unmarried. Hence there were 145 households which would, usually, have had a male Head.
|
The Mean age of the 1851 population was 23 although this figure is skewed by the number of children aged less than 1. Thus any averages calculated are not really helpful; i.e. the Median age is 19 whilst the Modal age is 0.
The charts below confirm that life expectancy was lower in 1851 than in the 20th and 21st centuries. Indeed, life expectancy at birth, which had been in the high 30s in 1837, had risen to 48 by 1901. Tuberculosis - was a major health problem. (Source: BBC) |
|
Click to enlarge